I recently had an issue where, after a software change on our servers, we started to notice that some systems had become unstable and were regularly crashing. The crashes sometimes resulted in a blue-screen, but other times resulted in a machine which responded to ping, but little else, and had a completely unresponsive console. The only course of action was to power-cycle the crashed server; clearly, not a good thing to do when we’re dealing with production servers.
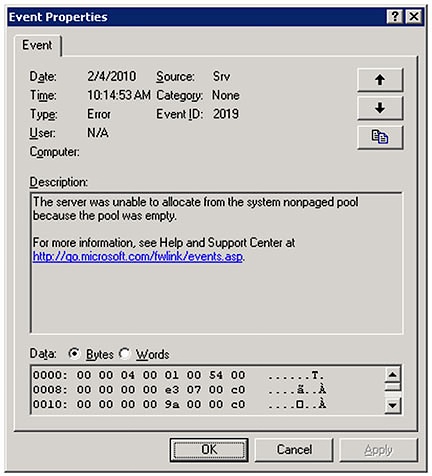
Upon investigation, we found that immediately before the crash the servers would log event 2019 in the System log – “The server was unable to allocate from the system nonpaged pool because the pool was empty”.
Figure 1 – Event 2019
Thankfully, the error message in the event log gave us a clear indication as to why the systems were in trouble, and allowed us to troubleshoot and diagnose the problem.
About nonpaged pool
The nonpaged pool is memory which always resides in physical memory – it is never paged out. It is used by the kernel and also by device drivers installed on a system to store data which might be accessed in situations when page faults are not allowed. The amount of memory allocated to the nonpaged pool varies, and is determined as a function of operating system, processor architecture, and physical memory size. For example, 32-bit operating systems, with their smaller address spaces, have lower limits:
32-bit Windows Server 2003 with 2GB or more of RAM will have a nonpaged pool limit of 256MB
32-bit Windows Server 2008 will have a nonpaged pool limit of either 2GB or slightly more than 75% of physical memory, whichever is smaller
64-bit operating systems, which have a much larger address space, have higher limits:
64-bit Windows Server 2003 will have a nonpaged pool of either 128GB or 40% of physical memory, whichever is smaller
64-bit Windows Server 2008 (or 2008 R2) will have a nonpaged pool limit of either 128GB or slightly more than 75% of physical memory, whichever is smaller
Pool size data is from Mark Russinovich and David Solomon’s book “Windows Internals, 5th Edition”, and Mark Russinovich’s blog posting “Push the Limit’s of Windows: Paged and Nonpaged Pool”.
One way to see the nonpaged pool limit on a specific system is to install the Debugging Tools for Windows, and then use Sysinternals’ Process Explorer to display the pool size. (The debugging tools are required to provide access to debugging symbols.)
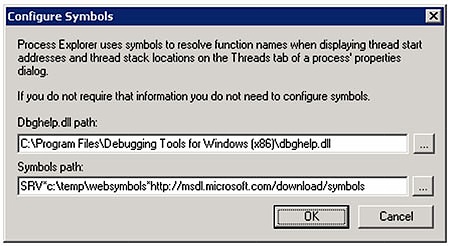
Once the tools are downloaded and installed, launch Process Explorer and click Options -> Symbol Configuration, point it to the dbghelp.dll file installed with the Debugging Tools, and configure Microsoft’s symbol server as the symbol file path.
Figure 2 – Process Explorer Symbol Configuration
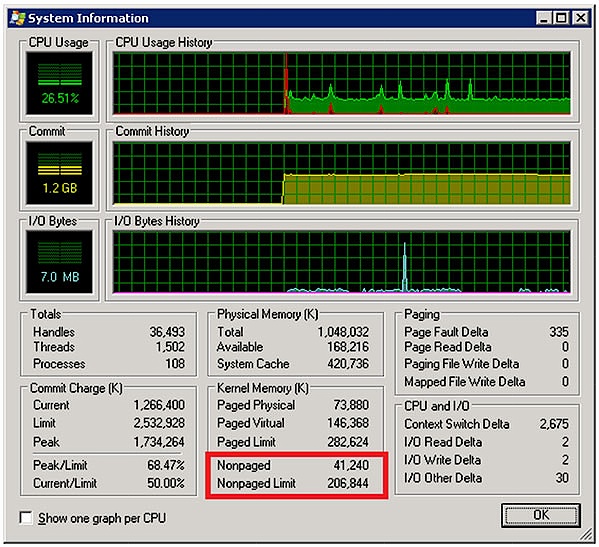
The nonpaged pool size can then be found on the System Information dialog (click View -> System Information or press Ctrl+I):
Figure 3 – Nonpaged pool allocation and limit on 32-bit Windows Server 2003 with 1GB RAM
Back to the problem
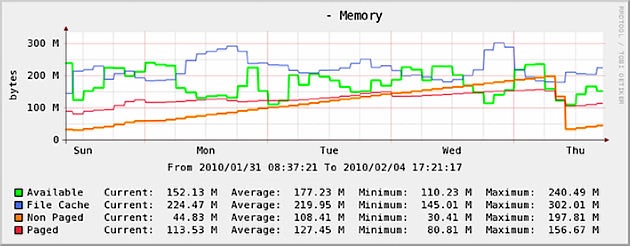
We were monitoring memory usage on one of the constantly crashing systems, including the performance counter for nonpaged pool allocation – Memory\Pool nonpaged bytes. The orange line in Figure 4 is nonpaged pool usage, and the plot shows usage growing steadily over time, and then reducing sharply whenever the system is rebooted.
Figure 4 – Memory use over time
We quickly realised that what we were seeing was most likely a memory leak in a driver or kernel component. Armed with this knowledge and data, the next step was clearly to find out exactly which driver or component is consuming the pool.
The tool for this job is the Memory Pool Monitor, poolmon.exe, which is included in the Windows Support Tools on the Windows Server 2003 CD, or alternatively can be downloaded from the Microsoft Download Centre as part of the Windows Server 2003 Support Tools package. Poolmon displays the amount of pool storage (both paged and nonpaged) in use, all of which is categorized by a pool tag, which is usually a four-character string used when calling the kernel APIs for allocating pool storage.
After launching poolmon, press the ‘p’ key to filter for paged or nonpaged pool, the ‘b’ key to sort the output by bytes, or the ‘d’ key to sort by the difference between pool allocations and pool frees. With the output set to nonpaged and sorted by bytes, the display could look similar to this:
Figure 5 – Poolmon.exe
The top line of the output is showing that the tag “SbAp” has made 2,187,628 allocations of 56 bytes and no frees, resulting in 122,507,168 bytes of nonpaged pool use – by far the biggest consumer on the system, and responsible for over 60% of the pool use. This looks like the likely cause of the memory leak.
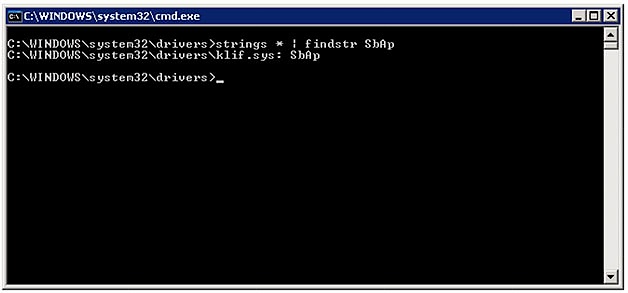
Now that we know the tag we’re looking for, we need to find out which device driver is using it, and there are a couple of ways to do this. If the tag is used by a kernel component or driver, and the Debugging Tools for Windows are installed, then the tag will be listed in the triage\pooltag.txt file located in the debugging tools folder. If the tag isn’t listed in pooltag.txt, then we need to find it using the Sysinternals’ Strings utility, strings.exe, to hunt it down. Since the tag is stored inside the driver file, and most driver files are in %SystemRoot%\System32\drivers, we can easily use strings.exe to quickly search all the files for the tag. So, the search for the “SbAp” tag returned one driver file: klif.sys.
Figure 6 – Using strings.exe to find the driver
Once we had identified the device driver, we could identify the manufacturer and get help from their technical support department. Thankfully, In this case we were able to contact the software vendor and get the problem solved very quickly, preventing any further crashes and loss of productivity.
It’s worth bearing in mind that the same technique can also be used to troubleshoot paged pool problems as well, which will present as event ID 2020, with the text “The server was unable to allocate from the system paged pool because the pool was empty”. The only difference is to use poolmon to display the paged pool instead of nonpaged pool.
The basic process in both cases is:
Use the event log message to find out if you’re facing a paged or nonpaged pool problem
Use poolmon.exe to find the offending tag
Use pooltag.txt or strings.exe to identify the component or driver
Enlist the vendor to fix the memory leak
Whether you have a paged or nonpaged pool problem, once you have the right tools and know what to look for, these problems are really not especially difficult to troubleshoot.
