Understanding the Performance Tab in Windows Task Manager.
The performance tab is always a good thing to keep your eye on. It a valuable tool to monitor performance and troubleshoot performance problems. I will try to explain the confusing data that is presented in the Performance tab of Task Manager.
Note: I know all of us have 2gigs or more of memory, and memory performance is not really an issue but this is just some knowledge you can use. You can tell your parents that you learned something interesting today.
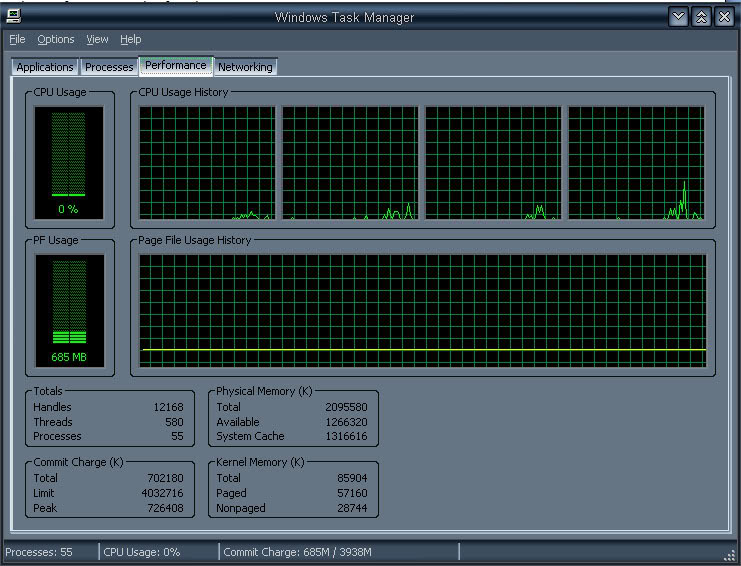
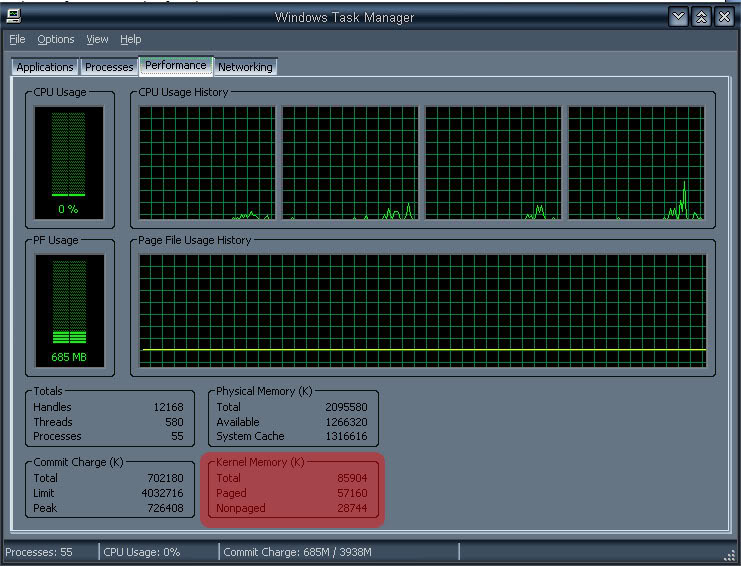
Typical Performance Tab
Numbers look daunting and confusing
Keep in mind that the values expressed in the Physical Memory, Commit Charge, and Kernel Memory panels are in kilobytes. As such, dividing by 1024 reveals the megabyte value.
Graphs:
CPU Usage – This is pretty obvious, it indicates the percentage of processor cycles that are not idle at the moment.
PF Usage – Indicates the percentage of the paging file that is currently being used. This value is sort of misleading, it actually shows the amount of physical memory/page file space being used by your system. Synchronous to Total under Commit Charge (K).
CPU Usage History – Just a graph which indicates how busy the process has been recently, the number of graphs correspond to the number of cores your processor has.
Page File Usage History – Same as CPU Usage History just for your page file usage since Task Manager has been opened.
Now for the data that is confusing but valuable.
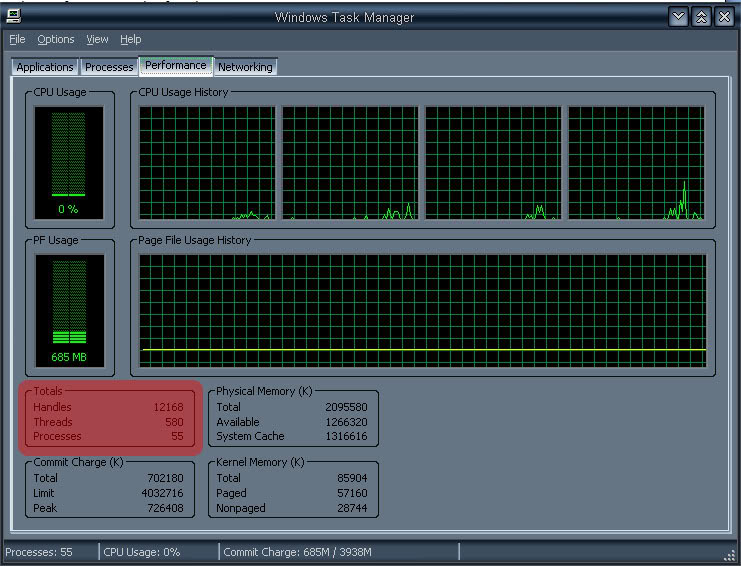
Totals Section
Handles – represents the number of specific input/output (I/O) instances running. Displays the total number of resources the OS is working with at one time. Resources can be anything, files, directories, events, processes and registry keys.
Threads – represents the number of objects that are currently executing program instructions
Process – is a single executable program, a process may have multiple threads each of which in turn have multiple handles. If you’re running 3 word documents, there will be three processes running. This corresponds with the number of processes running under the Process Tab.
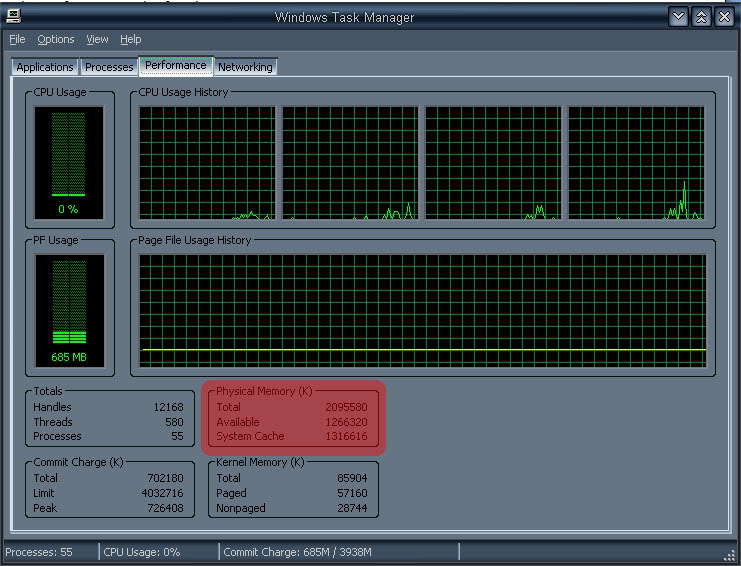
Physical Memory (K) Section
Total – the amount of physical memory that your system has installed and that the OS has detected. According to the graph my system is 2GB.
Available – The amount of physical memory you have available for the system to use. If you find very low ram available continuously, you are going to bottleneck your system, because if you have none available, the OS will resort to using virtual memory and accessing your harddrive.. Time to add some more memory. According to the graph my system has 1.2GB available
System Cache – Not important for system bottlenecks. If you must know, it is an area of memory used by system processes.
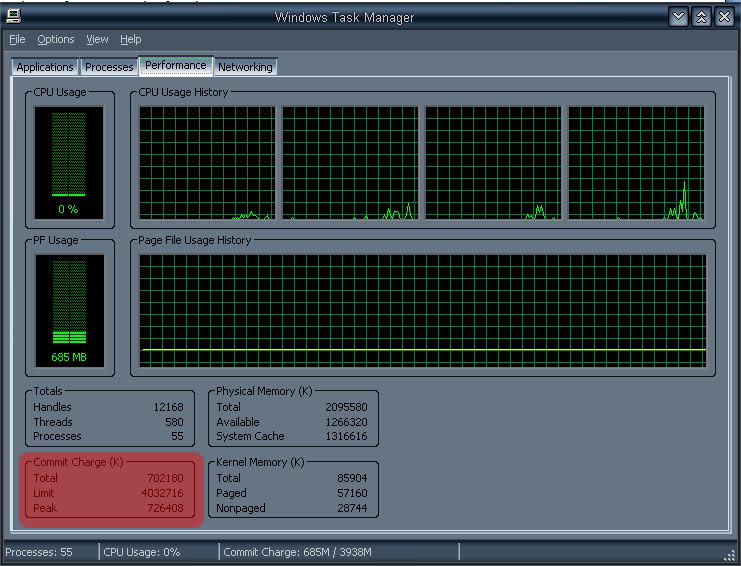
Commit Charge (K) Section
Total – How much memory (physical and virtual) is actually in use by program and processes. In the above table i am using 702MB of 4GB of memory (physical and virutal combined)
Limit – this is the maximum possible value for Total. This is the sum of the current pagefile size plus your total physical memory. 4GB is available, 2GB physical + 2GB virtual
Peak – represents the highest combined total of physical memory and virtual memory that has been used since boot up. As you can see I only used a little under 1GB of memory in my highest peak.
Kernal Memory (K) Section
In the Kernel Memory panel, you will find statistics on the memory that is being used by the operating system and device drivers.
Total – value represents the amount of physical memory that the OS uses for core operations and for managing device drivers. In the above example, it comes out to be 83 megabytes
Paged – value represents the amount of memory used by core operations and device drivers that can be moved from physical memory to the page file if necessary. In the above example, it comes out to be 55 megabytes
Nonpaged – value represents the amount of core components and device drivers that can never be moved from physical memory to the page file. In the above example, it comes out to be 28 megabytes
Okay so what does all this tie into, here are some several points which relate to memory and are good to remember. Starting from the top.
* If the Commit Charge Total value regularly exceeds the Physical Memory Total value, your system has to rely more frequently on the much slower page file (virtual memory). Its time to add more physical memory.
* If the Commit Charge Total value is near the value of Commit Charge Limit value then WTF are you doing, not only did you use up all your physical memory but also you used up all your virtual memory. Your computer is at its knees begging for mercy.
* If your Commit Charge Peak value is near the Commit Charge Limit value then you are completely maxing out at one point or another during your computer being turned on. Your computer is at its knees begging for mercy once in a while for a few seconds.
* If your Commit Charge Peak value comes close to or exceeds the Physical Meory Total value, your computer had to access virtual memory once or twice. Performance might not be affected, but you are at the upper limit of using all your memory.
* More than 50% of the core operating system components and drivers can be swapped out from physical memory to the page file, moving such portions of the OS can significantly yield a performance hit. This again indicates the advantage of using more physical memory.
